

Let's begin with the basic of:
x= cos (t)
y = sin (t) for 0 < t < 2pi

Notice that keeping a=1 and b = 1 we get a simply circle with a center at the origin and a radius of 1.
Let's observe what happens as we change the values but keep a = b.


We end up with the same circle. Therefore, as long as a = b, then the graph will be a circle with a center at the origin and a radius of 1
Let's observe what happens when we keep a constant and increase b....


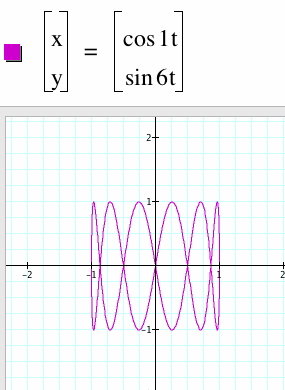
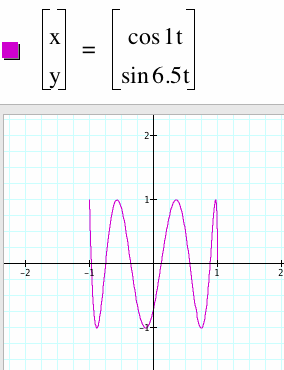
When a < b, you notice that the number of loops formed is represented by b. Therefore, we can say loops = b/a. There is an exception, b has to be a whole number. Looking at the last graph when b= 6.5 notice that the loops are not complete but you have 6.5 curves. Moreover, when b is a whole number then the graphs are symmetrical about the x- & y-axis.
*Note that the graphs always stay within a certain parameter. Instead of a circle with a diameter of 2, we have a boundary of a sqaure with a length of 2 units.
What happens when we keep a = 2 and increase b....


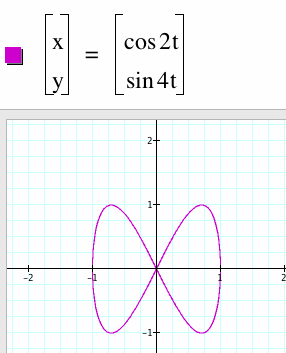
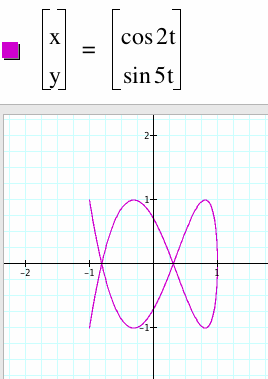
Notice that the number of loops is still equal to b/a....
Let's observe what happens when a = 3 and we increase b.

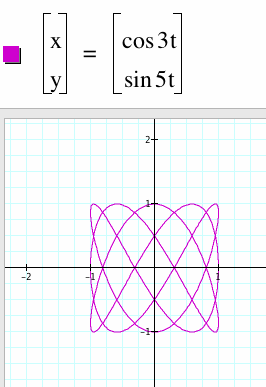

Note that in the first graph, when a = 3 and b= 1, we get 3 loops. This is similar to when a=1 and b= 3 but now the graph has rotated 90 degrees. Looking at the second graph we get something more interesting.. a is still less than b but we don't get b/a loops..or do we?? In fact what you will is 5 loops along the x-axis and 3 loops along the 3-axis. Yet, looking at the last graph we are back to the loops are equal to b/a..we will have to do more investigations.
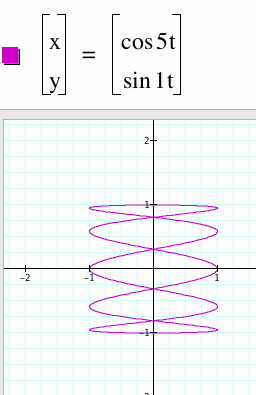
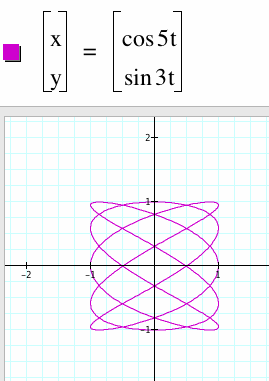

There is a conclusion that can be made looking at these graphs now: If a > 2 and b > 1, when b/a does not yield a whole number then we get a graph with a loops along the y-axis and b loops along the x-axis....
Here are some interesting graphs of the parametric equations... can you guess the values of a or b
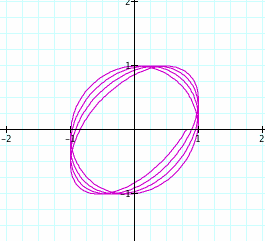

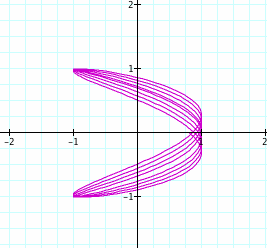
Respectively, a = 3.1, 0, and 8.1 and b = 4 on all graphs.